
FF Names 3


As always all numbers and metrics are from the amazing College Basketball section of Sports-Reference.com
For the 2015-16 Syracuse basketball team to regain its place among the best programs in the country and challenge for an ACC title, two major things must occur:
To do the latter the ‘Cuse doesn’t need to find a replacement for Christmas himself, but rather make up for the lost production that left when the senior was drafted in the second round by the Cavs (he was later traded to Pacers and is currently suiting up for their D-League affiliate the Fort Wayne Mad Ants).
Syracuse also lost a potential impact big when Chris McCullough decided to turn pro after playing just 16 games as a freshman before a major knee injury.
Since there is no one player on the roster capable of being the focal point in the front court, especially on offense, picking up the slack will become a team effort. That missing productivity can, and will have to, be supplemented through the collective efforts of a finally healthy DaJuan Coleman, still very raw Chinonso Obokoh, freshman Tyler Lyndon and Malachi Richardson as well as junior forward Tyler Roberson.
Of all of those options its Roberson who has the experience and talent to make the biggest difference. Richardson will have something to say about that, but his all around skill set will allow him to impact the game in various ways both inside and out of the post. He has the skills of a guard and will likely play a versatile role in the offense this year, whereas Roberson is more of a traditional power forward.
Roberson joined the Orange as part of the loaded 2013 recruiting class including five start point guard Tyler Ennis and now departed B.J. Johnson and Ron Patterson. Obokoh was also part of that group. Roberson was a four star recruit according to Rivals and was listed at 6’8 210 pounds, which is right about where he’s at currently.
In a perfect world Roberson would continue on his solid sophomore year improvement and become an indispensable part of the front court rotation. The reason the hopes are so high for the junior from Union, NJ is because he has the athleticism to score around the basket, beat opponents for rebounds and cover ground defensively in the 2-3 zone.
Syracuse has seen the rapid rise of two other front court players in recent years. While neither is a perfect facsimile of Roberson they both share pieces of his skill set and affect the game in similar ways. They also represent a best case scenario of sort for the talented Roberson, as both made impressive strides during their tenure. The major leaps both C.J. Fair and Rakeem Christmas made are no guarantee for Roberson to replicate but lets take a look at all three players career stats.
This first set shows Minutes per Game, Usage% and Field Goal Attempts per 100 possessions. (For a look at any of the metrics used check out my last post, which also has links to other sources). These three metrics do a solid job showing the effect a player has on an offense from a volume perspective. I like the term offensive “gravity” but the great Kevin Pelton of ESPN uses that term to describe the attention an offensive player draws from defenders, which is not the same as what we’re talking about here. For now I’ll refer to what we’re looking at as offensive “volume”.

If you look at Roberson’s stats you notice that aside from a 254% increase in minutes per game (a massive jump that eclipses both Christmas and Fair) he actually took up less offensive volume in his sophomore year. At the same time Roberson is not the type of player offensively who will ever be a go-to scorer or primary option. What is interesting though is that he actually has a higher second year USG% and FGA per 100 possessions than Fair or Christmas.
At first glance that seems like a misprint but maybe that’s actually a reminder that it took stellar junior and senior seasons for Fair and Christmas to become the offensive centerpieces we remember them for. For example, Christmas had the lowest USG% rate of 12.2% his junior season. For perspective, that would be lower than any player last year that averaged at least 10 minutes per game (which includes all scholarship players except Obokoh). That would leave him 3.1% lower than Ron Patterson, the lowest usage player in 2014-15 other than Obokoh at 5.1%. Christmas then spiked to 25.8% in his senior season, which represents a 111.48% increase. Fair’s increase in usage and FGA was much more steady but he ended higher than Christmas in all three categories.
So to summarize, despite USG% and FGA per 100 possessions actually declining, Roberson’s sophomore offensive volume metrics actually lead both Fair and Christmas with the biggest gainer from his freshman year being minutes per game. Remember, however, the frequency of shots has nothing to do with how often they’re actually made. To see how effective a player is offensively we need to gauge his efficiency.

As we saw earlier Roberson is on a trajectory to outpace Fair and Christmas in overall shooting frequency, but does that mean he’s been more effective? Looking at a few metrics like points per 100 possessions, Offensive Rating and PER will help us determine that.
In terms of producing points Roberson seems to be well behind Fair’s pace but in line with that of Christmas. 17.4 points per 100 possessions isn’t much but that relatively low number wouldn’t mean much if it wasn’t paired with the high volume numbers in the previous section. Meaning, the fact that Roberson didn’t average many points compared to Fair and Christmas would be a small point if he didn’t also shoot more or “use” more possessions as measured by USG% and FGA per 100 possessions. Having said that both ORtg and PER attempt to quantify how efficient a player is and should in theory reflect that themselves. Roberson’s PER is again behind Fair’s but above Christmas’ pace, yet saw a large uptick (50.91% increase), while his ORtg is actually an outlier (in the positive direction) in this data set. 145.5 is well above any other rating and more than 20 points above Fair’s two highest postings.
We haven’t really gotten into how each players scores their buckets, which is clearly a huge factor in this discussion. Without the benefit of advanced spacial tracking data like the NBA gets from SportVU or Synergy Sports we’ll have to make some educated guesses. From casual observation the skill sets are relatively distinguishable. Fair was by far the most effective shooter of the three, eventually even becoming a three point threat. Christmas mainly operated down low and became a dynamite back to the basket player in the low post.
Roberson is a bit of a hybrid of the two: not developed enough to be a consistent jump shooter but also not limited to scoring on post ups. The real key in Roberson’s development will be his shooting ability. If he can refine his mechanics and establish a smoother stroke he could become a legitimate offensive threat who can create points without having plays designed for him much in the vein of Fair.
It seems a little strange that even though Roberson’s volume numbers are high and his points per 100 possessions are low that he still manages to post solid PER and excellent ORtg ratings. Nonetheless its a good sign for his development as scoring points but doing so efficiently is really the sweet spot in basketball.

Finally we’ll look at what, in theory, will sum it all up for us. These metrics vie to quantify all the various factors in basketball and distill them down to a number that signifies a player’s overall impact. Offensive Wins Shares, Win Share per 40 minutes and Offensive Box Plus/Minus all seek to answer the age old question of who will add the most wins to a team. OWS and WS/40 follow similar methods but in this case paint a pretty cloudy picture.
C.J. Fair’s outstanding ratings all the way around in this category ins’t too surprising. Fair was the clear go-to option his final two seasons and was quietly effective in limited action early on. With his all-around game and ability to score inside, outside and transition he was clearly a huge positive to the Orange.
What is shocking is that Christmas’ final year (one where he carried the ‘Cuse offense at times) posted a pedestrian 0.045 WS/40 and negative marks in OWS and OBPM. While the fact that Christmas was forced to be a high volume workhouse would certainly hinder his ability to produce efficiently and therefore lower his relative value in some of the metrics, there is no doubt from my untrained eye that he was by far the Orange’s best offensive player last season.
Roberson seems to somewhat shadow Christmas’ trajectory from season one to season two. While these metrics have great value, because of their complex nature I think its fair to praise Fair for his excellent ratings but somewhat overlook Christmas’ poor marks.
Roberson’s value metrics aren’t stellar, but the massive increase in the positive direction from year one to two suggests as he’s gained experience he become more and more valuable to the squad. We should temper our expectations but seeing win shares and other value based ratings shoot up is incredibly encouraging.
What’s key to note as we wrap up here is that we’ve pretty much limited our evaluation to the most obvious offensive skill of scoring. To me what’s most encouraging for Roberson is that scoring is actually the weakest part of his offensive game and he still seems to be progressing in line with eventual offensive studs.
Roberson’s game is predicated on athleticism and hustle and has his biggest impact on the offensive boards. He grabbed 11.1% of available offensive rebounds last season, which was second on the team to Obokoh who did so in limited playing time. Roberson also lead front court players with an 11.3% assist rate.
When its all said and done Roberson will have to follow in some pretty impressive footsteps to be as effective on offense as C.J. Fair and Rakeem Christmas, but there are signs that he can make a similar progression.
Since we now have some more recent and context relevant data from the NBA Summer League, what I have here might not mean as much now as it did before the Draft when we were left with nothing but college stats to project future NBA production. But here goes anyway.
Data Set, Source and Explanation:
All stats from Sports-Reference’s College Basketball section
Sample Size: Prospects drafted by an NBA franchise from 2010-2015 and played significant time* against NCAA competition. Stats are taken only from the player’s most recent college season**
SPOILER ALERT: The analysis and conclusions drawn are sloppy…on purpose. You’ll see why
USG% vs PER

This chart is interesting to me. You would certainly expect that as a player’s usage increases, his efficiency decreases. It makes sense right? Its easier to maintain a high efficiency if you’re not asked to repeat that success on a repeated basis. Another less obvious factor is that if your usage is lower, you are likely not a top offensive option meaning you probably also benefit from the attention those better (theoretically at least) offensive options draw.
So why is this graph suggesting that as USG% increases so does PER?
Well, there are a few possibilities. Maybe our original assumption was false. Or maybe PER doesn’t measure efficiency well and/or USG% is not an effective measure of usage. Maybe both?
For the record PER stands for Player Efficiency Rating and was developed by John Hollinger, now of ESPN. There has been much debate about how effective a measure of overall quality it is, but most would assume its designed to measure efficiency because, you know, it has that in the name. A full explanation from Hollinger of what PER is and how its calculated is here. A criticism contesting it gives too much credit to high volume production and therefore is a poor estimate of efficiency is here. You decide.
Now lets take a look at a similar data set that uses Offensive Rating (originally developed by Dean Oliver) instead of PER. An explanation of O Rtg (a common abbreviation) is in Oliver’s great book “Basketball on Paper” but Sports-Reference takes a stab at it here.

Now let’s take a look at these graphs with trend lines.

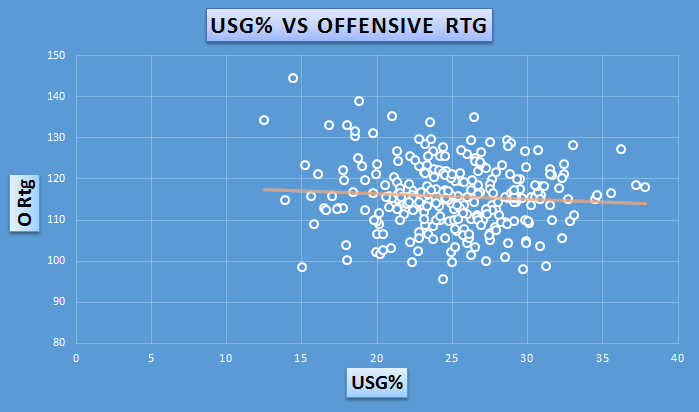
It’s dangerous to judge the effectiveness of a metric on a limited and very subjective opinion. Nonetheless it seems that Offensive Rating fits our assumption a little better. Does that mean its more accurate? Certainly not, but its quite interesting if you ask me.
It’s also important to note that this data is not by any means the best way to evaluate these metrics in a general sense. They are specific to a 6 year window and limited to one season of college production. But, they might help us answer some questions or at least visualize them. What’s key is to use any data or representations of them wisely and don’t make assumptions or extrapolate recklessly.
So with that in mind I think what we can say is the truth in our assumption (that increase in usage means a decrease in production) depends on your definition of efficiency and whether or not you think PER or O Rtg accurately measures it. That’s because one suggests that assumption is true and the other suggests its not.
Now for the REAL analysis. When I first drew up these charts I made some hasty assumptions without thinking about what was actually being measured. Philip Mudd cautions against doing this in his book “The Head Game”. In it he stresses the importance of avoiding the temptation to dive right into the data and, therefore, waste time or worse distort you judgement by not having a clear goal or plan in place to shape your efforts.
In an effort to increase the effectiveness of any analysis of this issue, I’ll fully address this in another article, but will venture to say the following:
What we were really looking at was not how a player’s efficiency changes based on usage. To do that you’d have to examine an individual player’s usage and efficiency relationship over the course of some period of time. What I did above was just plot a group of draftees usage and efficiency and try to find a trend. So really there is a better way to visualize and assess the prior question. I’ll do my best with the available data, stay tuned.
SO, WHAT DOES THIS MEAN?
In short, its easy to draw conclusions from data and particularly pretty pictures and charts without properly scrutinizing their accuracy or scope.
So, the charts DO NOT say:
– The more a player is involved in the offense (higher usage %) the more or less efficient he becomes. That conclusion would have to be drawn from player specific data.
What the charts MIGHT SAY:
– High level college basketball players who have higher usage ratings tend to be more involved in the offense for a reason. The reason being they are really good.
Quick Notes:
Strengths: Impeccable footwork, a wide array of post moves, pro body with length and strength, physically ready to contribute on offense, instant offense as a post up threat, decent mid-range shooter, high character individual
A clear testament to Okafor’s dedication and innate feel for the game is his effortless foot work in the post. He navigates the paint with grace and has a smoothness to his game that catches the eye and makes him so tough to defend. He’s comfortable turning over both shoulders on his drop set and shows a soft touch around the basket. Rarely do teams prioritize touches for a low post scorer nowadays but Okafor certainly gives you that option.
Weaknesses: Lack of long range shooting ability, defensive limitations, lapses in effort on defense, can be exposed as a poor pick and roll defender, lacks elite athleticism and explosiveness
The biggest knock on Okafor is that he only has value on the offensive end, and even there he is limited to post up production. He may be an elite back to the basket scorer, but with the direction the game is headed that skill continues to be devalued. Blessed with a 7’5 wingspan he has the length to disrupt passing lanes and challenge shots, however, due to his average lower body explosiveness he’ll never be a game changing shot blocker or elite lob finisher.
Bottom Line: The 6’11 275 lb freshman is a force on the offensive block possessing the dexterity and body control to create space for his shot out of several well executed post moves in his arsenal. In this respect Okafor is much more advanced than Towns and perhaps any incoming rookie but its the struggles on defense that makes him a one way player at the moment. Not only that but he rebounds at a lower rate (16.6% versus Towns’ 18.5% TRB%) and is a much more limited shooter (0 three pointers taken and 66.7% from the stripe). All that being said, Okafor can give you production from day, works hard off the court and has the physical traits to improve as a rebounder and low post defender.
BODY TYPE:
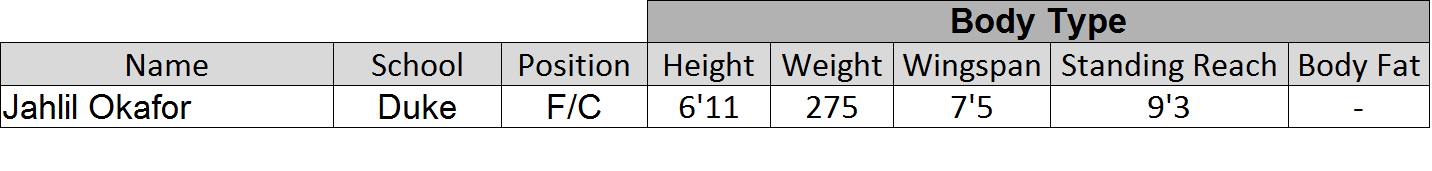 Okafor has a pro ready body and edges Towns in terms of strength, power and wingspan. His athletic potential is limited, however, and for all the lateral agility he shows on offense he really struggles redirecting and staying in front of defenders and could be a major liability on pick and rolls.
OFFENSIVE USAGE:
 In contrast to Towns, Okafor is an offensive force in terms of pure production. To produce more points requires more shots, which is clearly the case with JO. His overall efficiency suffered as is to be expected, but what stands out positively is his ability to draw fouls and therefore free throws at a high rate (.103 per possession). Normally those would be efficient shots, however, with his poor FT% of .510 that really mitigates the benefit.
SHOOTING:
 While not being able to stretch the floor Okafor does a masterful job generating clean, high percentage looks at the rim from post ups. It’s become an axiom in the analytics world that three’s, free throws and shots at the rim are the most efficient in basketball. Okafor is a non-factor from three, has a terrible free throw percentage but does get shots at the rim in bunches. Overall though his inability to stretch the floor or convert from the line will put a hard cap on his efficiency. The saving grace may be his footwork in the post and propensity to get his shot off cleanly around the basket seems to have transferred to the pro game.
REBOUNDING AND DEFENSE:
 Okafor actually hits the offensive glass at a slightly higher rate than Towns, but that’s likely a product of shooting more around the rim increasing the opportunity to rebound his own shot. His noticeably higher Defensive Rating (with D Rtg a lower score is better) is intuitive considering his poor defensive reputation but he does appear to be less foul prone.
Strengths: Gifted shot blocker, size and length with elite rebounding potential, terrific shooter with 3 point range, 81% free throw shooter, overall very few flaws
Towns has the ability to impact the game on offense and defense with a very diverse skill set for a freshman prospect. He has really made his mark on the defensive end blocking and altering shots at a breathtaking rate (11.5% Block Rate!). As a gifted shot blocker and proficient rebounder with the length to improve even further, Towns has the raw ability to dominate the low post. On offense the 6’11 250 pounder has good range for a big. Although he has limited post moves he does shows good touch and the vision to hit teammates for open jumpers or cuts to the basket.
Weaknesses: Lacks a refined low post game offensively, needs to add strength to his frame, could benefit from playing with more grit and fire, foul prone
Sure there are some minor imperfections here but overall Towns is a well-rounded prospect. He could certainly continue to hit the weights in order to handle the physicality of the NBA game. While showing some natural ability it will take some time before he becomes a true offensive threat on the block. The one clear advantage Okafor has over Towns is his footwork and variety of post moves on the offensive end although neither are elite athletes.
Bottom Line: Towns gets the nod over Okafor and Russell because he’s a rare low post asset who can affect the game in multiple ways. He edges them both in PER, Win Shares, Rebounding Rate and Free Throw Percentage. At the end of the day Towns checks off more boxes and affects the game on both ends. He has two coveted skills that when packaged together allow for rotational flexibility for a coaching staff and could yield an All-NBA level center: elite shot blocking ability and shooting range out to the three point line.
BODY TYPE:
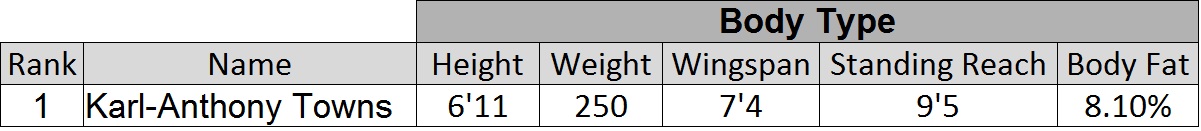 “KAT” has a legitimate NBA frame that has room to grow stronger as he matures. Prototypical height and length with a solid build that will only be refined.
OFFENSIVE USAGE:
 Usage wise, the data are pretty clear and intuitive. On a stacked Kentucky squad Towns was not asked to be an offensive juggernaut or even a go to player on that end of the court. For comparison Jahlil Okafor had a higher usage (USG% 27.6%, FGAPP 0.223) but was less efficient (PER 30.7, O Rtg 119.9).
SHOOTING:
 Despite a lower eFG% and 2P% his range and pure shooting ability (FT% is a solid indicator) are excellent for a big with his level of defensive ability.
REBOUNDING AND DEFENSE:
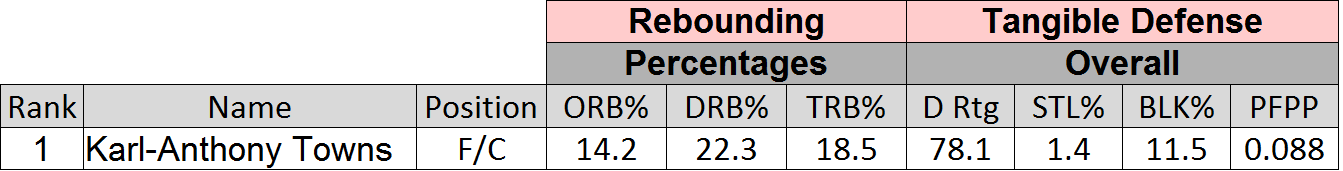 A few things jump out here that succinctly illustrate his tremendous value and unique skill set. His ridiculous Defensive Rebounding Rate of 22.3% points to a prospect with elite rebounding potential. His Defensive Rating of 78.1 is in part due to his insane Block Rate of 11.5%! Think about that, he blocked an estimated 11.5% of the shots taken when he was on defense! Now that’s a rim protector.
